What is bounce rate and why it matters for your business

Many small business owners panic when they see their bounce rate climbing, assuming every visitor leaving after one page signals failure. This knee-jerk reaction misses crucial context. Bounce rate measures single-page sessions without further interaction, but understanding what drives those numbers reveals opportunities to improve website engagement and performance. Whether your bounce rate indicates problems or perfectly satisfied users depends entirely on your site’s purpose, industry, and visitor intent. This guide cuts through the confusion to help you interpret bounce rate correctly and use it strategically.
Table of Contents
- Bounce Rate Benchmarks And Why Context Matters
- What Bounce Rate Reveals About User Experience And SEO
- How To Use Bounce Rate Data To Improve Your Website
- Get Expert Help To Reduce Your Bounce Rate And Boost Engagement
- Frequently Asked Questions About Bounce Rate
Key takeaways
| Point | Details |
|---|---|
| Definition clarity | Bounce rate shows the percentage of sessions where users view only one page before leaving without any interaction |
| Industry variation | Benchmarks differ dramatically: ecommerce sites average 20-45% whilst blogs naturally reach 70-90% |
| Context is critical | High bounce rate isn’t inherently negative, it depends on site type, page purpose, and whether users found what they needed |
| SEO relationship | Bounce rate doesn’t directly affect rankings but reflects user experience signals that influence search visibility |
| GA4 calculation | Google Analytics 4 calculates bounce as the inverse of engagement rate, requiring 10+ seconds, 2+ pages, or conversion events |
Understanding bounce rate: definition and calculation
Bounce rate fundamentally measures visitor behaviour on your website. When someone lands on a page and leaves without clicking anything, scrolling significantly, or triggering any interaction, that counts as a bounce. The bounce rate is the percentage of single-page sessions where users leave without further interaction.

Traditional analytics platforms calculate this using a straightforward formula: divide single-page sessions by total sessions, then multiply by 100. If 100 people visit your site and 45 leave after viewing just one page, your bounce rate sits at 45%. Simple maths, but the interpretation requires nuance.
Google Analytics 4 changed the game entirely. Rather than tracking bounces directly, GA4 views bounce rate as non-engaged sessions, essentially flipping the metric. GA4 considers a session “engaged” if it lasts 10 seconds or longer, includes two or more page views, or triggers a conversion event. Bounce rate becomes 100% minus your engagement rate.
This shift matters because it filters out ultra-quick exits that might have counted as bounces in Universal Analytics. Someone spending 15 seconds reading your contact details before calling directly no longer inflates your bounce rate artificially. The new calculation better reflects genuine disengagement versus quick satisfaction.
Key differences between traditional and GA4 bounce calculations:
- Traditional analytics count any single-page session as a bounce regardless of time spent
- GA4 requires either multiple pages, 10+ seconds, or a conversion to avoid bounce classification
- GA4’s approach reduces bounce rates for content-heavy pages where users find answers quickly
- The bounce rate definition varies between platforms, making cross-platform comparisons tricky
Understanding which analytics version you’re using prevents misinterpretation. A 60% bounce rate in Universal Analytics might translate to 45% in GA4 for the same traffic pattern.
For SME owners, this technical distinction shapes how you improve a website’s bounce rate. Focus on engagement signals rather than obsessing over the raw percentage. Time on page, scroll depth, and conversion events tell richer stories about visitor satisfaction.
Bounce rate benchmarks and why context matters
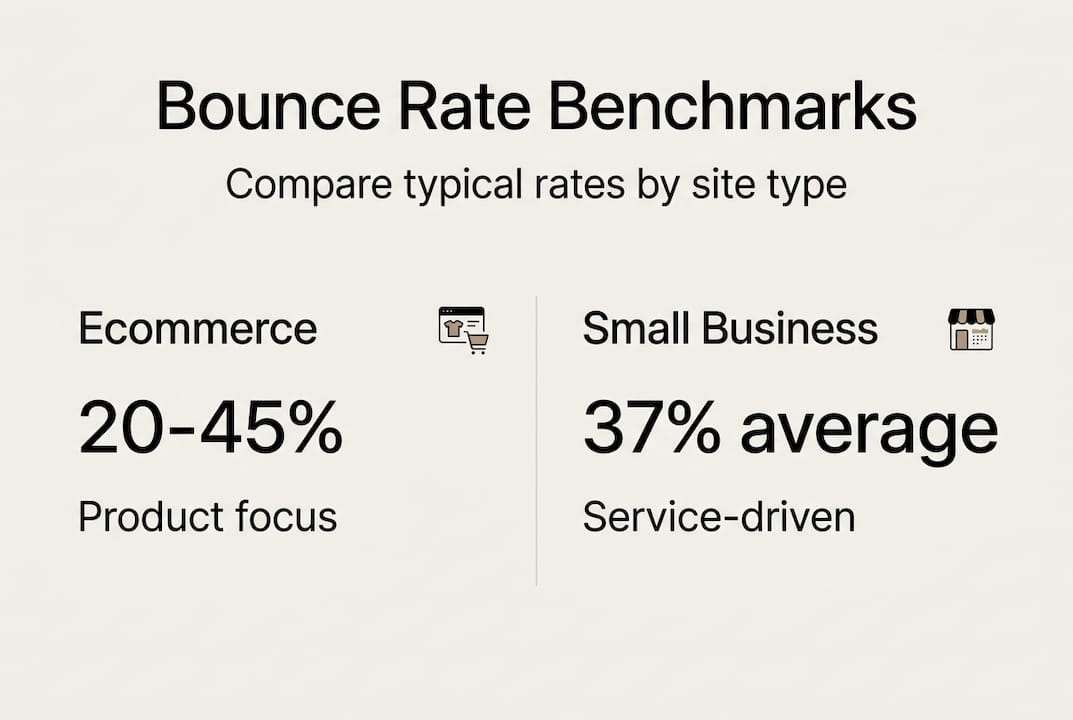
Judging your bounce rate requires industry context. A 70% bounce rate might spell disaster for an ecommerce site but signal success for a blog post answering specific questions. Average bounce rates vary significantly: ecommerce sites typically range from 20-45%, blogs naturally hit 70-90%, SaaS platforms sit between 35-55%, and service businesses span 15-50%.
The overall median hovers around 45%, whilst small business sites average approximately 37%. These figures provide rough guidelines, not absolute standards. Your specific bounce rate matters far less than understanding what drives it and whether it aligns with your goals.
Bounce rate expectations by site type:
| Site Type | Typical Range | Why It Varies |
| — | — |
| Ecommerce | 20-45% | Users browse multiple products before deciding |
| Blogs | 70-90% | Readers find answers and leave satisfied |
| Service Sites | 15-50% | Visitors explore offerings and contact pages |
| Landing Pages | 60-90% | Single-purpose pages with focused calls to action |
| Portfolio Sites | 10-30% | Viewers naturally browse multiple project examples |
High bounce rates aren’t automatically problematic. Someone searching “plumber emergency contact Manchester” who lands on your contact page, grabs your phone number, and rings immediately creates a perfect bounce. They got exactly what they needed without clicking further. Mission accomplished.
Single-page sites inherently generate high bounce rates because there’s nowhere else to go. If your entire business operates through one scrolling page, bounce rate becomes meaningless as a performance indicator. Judge success through conversions, enquiries, and actual business outcomes instead.
Tracking bounce rate trends over time reveals more than absolute values. A sudden spike from 35% to 65% signals something changed, perhaps a technical issue, traffic source shift, or content mismatch. Gradual increases might reflect evolving user behaviour or mobile traffic growth.
Pro tip: Segment your bounce rate analysis by traffic source and individual pages rather than viewing site-wide averages. Organic search visitors might bounce at 40% whilst social media traffic hits 75%, revealing which channels deliver engaged audiences. This granular view helps you prioritise optimisation efforts where they’ll generate the biggest impact.
Compare your bounce rate benchmarks against competitors in your specific niche when possible. Regional service businesses face different engagement patterns than national ecommerce brands. Your local competitor’s behaviour matters more than generic industry averages.
What bounce rate reveals about user experience and SEO
Bounce rate serves as a canary in the coal mine for user experience problems. When visitors consistently leave after viewing one page, something isn’t meeting their expectations. Common culprits include confusing navigation that hides key information, painfully slow page loading that tests patience, content that doesn’t match search intent, or mobile experiences that frustrate smartphone users.
High bounce rate signals potential UX issues like mismatched content and slow load times, impacting engagement and indirectly affecting SEO through user signals, though it’s not a direct ranking factor. Google’s algorithms don’t receive your Analytics bounce rate data directly, but they absolutely notice when users consistently return to search results after visiting your site.
This distinction matters enormously. Bounce rate itself won’t tank your rankings, but the underlying problems causing high bounces definitely will. Poor user experience manifests through multiple signals: quick returns to search results, lack of subsequent searches for your brand, minimal time on site, and low engagement rates.
Common bounce rate triggers and their UX implications:
- Slow loading times frustrate users who abandon before content appears
- Misleading meta descriptions create expectation mismatches
- Intrusive popups block content access immediately
- Poor mobile responsiveness makes navigation impossible on smartphones
- Irrelevant content fails to address the visitor’s actual question
- Confusing layouts hide calls to action and next steps
Low engagement reflected by bounce rates often suggests content doesn’t match user intent. Someone searching “how to fix leaking tap” expects a tutorial, not a sales page for plumbing services. When your content type misaligns with search intent, bounces skyrocket regardless of quality.
Fixing UX and content relevance simultaneously reduces bounce and improves engagement, indirectly benefiting SEO. Better experiences keep visitors exploring, increase page views per session, and generate the positive engagement signals Google values. Your SEO audits should always examine bounce rate patterns alongside technical factors.
Bounce rate functions as a diagnostic tool, not a performance metric. It highlights where problems exist without explaining why. Pair it with heatmaps, session recordings, and user feedback to understand the complete picture.
Pro tip: Analyse bounce rate alongside conversion rate and session duration for comprehensive insights. A 70% bounce rate with 5% conversion from the remaining 30% might outperform a 40% bounce rate with 1% conversion. Focus on business outcomes rather than vanity metrics.
The relationship between bounce rate and SEO operates through user satisfaction. When you improve bounce rate via UX enhancements, you’re actually improving the fundamental experience that search engines reward. Better content, faster loading, clearer navigation, and mobile optimisation all reduce bounces whilst strengthening your search visibility.
How to use bounce rate data to improve your website
Turning bounce rate insights into action requires systematic analysis and targeted improvements. Start by identifying which pages suffer from problematic bounce rates rather than treating your entire site as one entity. Your analytics dashboard reveals exactly where visitors disengage.
Step-by-step process for bounce rate analysis:
- Open GA4 and navigate to the Pages report under Engagement
- Sort pages by bounce rate to identify the worst performers
- Filter by traffic source to see if specific channels drive low-quality visits
- Segment by device type to spot mobile versus desktop discrepancies
- Compare bounce rates for different landing pages serving similar purposes
- Track trends over time to identify sudden changes requiring investigation
Comparing bounce rates across devices, traffic sources, and landing pages uncovers patterns. Perhaps mobile visitors bounce at 65% whilst desktop users bounce at 35%, signalling responsive design issues. Social media traffic might bounce at 80% compared to 40% from organic search, suggesting audience mismatch or misleading social posts.
Practical strategies to reduce bounce rate focus on removing friction and meeting expectations. Improving page load speed delivers immediate results because every additional second of loading time increases bounce probability. Compress images, enable browser caching, and minimise code bloat.
Aligning content with user intent prevents the disappointment that triggers bounces. If someone searches “freelance web designer rates UK,” they want pricing information, not your company history. Structure content to answer the implied question quickly, then provide supporting details for those wanting deeper knowledge.
Clear calls to action guide visitors toward logical next steps. After reading about your services, what should they do? Contact you? Read a case study? Download a guide? Make the path obvious with prominent, specific CTAs rather than generic “Learn More” buttons.
Proven tactics to lower bounce and increase engagement:
| Tactic | Implementation | Expected Impact |
| — | — |
| Speed optimisation | Compress images, enable caching, minimise scripts | 10-20% bounce reduction |
| Internal linking | Add 3-5 contextual links per page | 15-25% more page views |
| Content relevance | Match headlines to search intent precisely | 20-30% bounce improvement |
| Mobile optimisation | Responsive design, larger tap targets | 25-35% mobile bounce drop |
| Clear CTAs | Prominent, specific action buttons | 10-15% engagement increase |
Regularly monitor GA4 engagement rate alongside bounce to gauge improvement effectiveness. Engagement rate shows the percentage of sessions lasting 10+ seconds, viewing multiple pages, or converting. As you implement changes, both metrics should move in favourable directions.
Pro tip: Run A/B tests on high-traffic landing pages to identify which design, copy, and layout changes reduce bounce most effectively. Test one variable at a time, whether that’s headline wording, hero image choice, or CTA placement. Small improvements compound when applied across multiple pages.
The ways to reduce bounce rate extend beyond technical fixes. Content quality, visual design, trust signals, and value proposition clarity all influence whether visitors explore further. Audit your highest-bounce pages through fresh eyes, asking whether they deliver immediate value and clear next steps.
For service businesses, creating effective landing pages specifically designed for different traffic sources reduces bounce dramatically. Paid advertising visitors need different messaging than organic searchers. Tailor each landing experience to match the visitor’s context and expectations.
Connection between bounce rate and conversion optimisation runs deep. Many tips to increase conversion rate simultaneously reduce bounce by improving clarity, removing obstacles, and strengthening value propositions. Better experiences benefit every metric that matters.
Get expert help to reduce your bounce rate and boost engagement
Reducing bounce rate whilst improving conversions demands expertise across web design, user experience, and technical optimisation. Many SME owners lack the time or specialised knowledge to diagnose problems and implement effective solutions systematically.

Professional website design and development services in Buckinghamshire focus specifically on creating high-converting sites that engage visitors from the first click. Expert designers understand how layout, navigation, content structure, and visual hierarchy work together to reduce bounce whilst guiding visitors toward conversion actions. Comprehensive SEO audits identify exactly why your bounce rate sits higher than optimal, examining technical performance, content relevance, mobile experience, and user journey flows. These audits provide actionable recommendations prioritised by potential impact. Specialists who improve website bounce rates professionally combine analytics insights with conversion optimisation principles, testing improvements systematically to deliver measurable results. This expert support transforms bounce rate from a confusing metric into a strategic advantage that drives business growth.
Frequently asked questions about bounce rate
What is a good bounce rate for small businesses?
A good bounce rate for small businesses typically ranges between 26-55%, though context matters enormously. Service-based businesses often achieve 30-45%, whilst content-heavy sites naturally reach 50-70%. Compare your rate against industry-specific benchmarks and focus on trends rather than absolute numbers.
How is bounce rate different from exit rate?
Bounce rate measures single-page sessions where visitors leave without any interaction. Exit rate shows the percentage of sessions ending on a specific page after viewing multiple pages. Every bounce is an exit, but not every exit is a bounce.
Can a high bounce rate ever be positive?
Absolutely. High bounce rates indicate success when visitors find exactly what they need immediately, such as contact information, business hours, or quick answers. Single-purpose landing pages and blog posts solving specific problems naturally generate higher bounces from satisfied users.
How does bounce rate affect Google rankings?
Bounce rate doesn’t directly influence rankings because Google doesn’t access your Analytics data. However, the user experience problems causing high bounces do affect rankings through engagement signals like return-to-search behaviour and dwell time. Fix the underlying issues to improve both metrics.
How often should I monitor my website’s bounce rate?
Check bounce rate weekly for high-traffic sites and monthly for smaller sites. Focus on identifying sudden changes or concerning trends rather than obsessing over daily fluctuations. Quarterly deep dives comparing segments and pages reveal optimisation opportunities worth pursuing through systematic bounce rate improvement efforts.
Recommended


Book A Discovery Call
Stay Connected